Linear regression#
Exercise 1: Perform linear regression on two data sets#
The file 6.01_linear_regression_exercises_1.npz contains two datasets, y1 and y2 with common x-values in x.
For each dataset
plot the data
perform linear regression
plot the regression line (predictions from the linear regression)
interpret the result - based on your results: are x and y1 (or y2) related in a meaningful way? are they linearly related?
# your solution here
import numpy as np
import matplotlib.pyplot as plt
import scipy
d = np.load('6.01_linear_regression_exercises_1.npz')
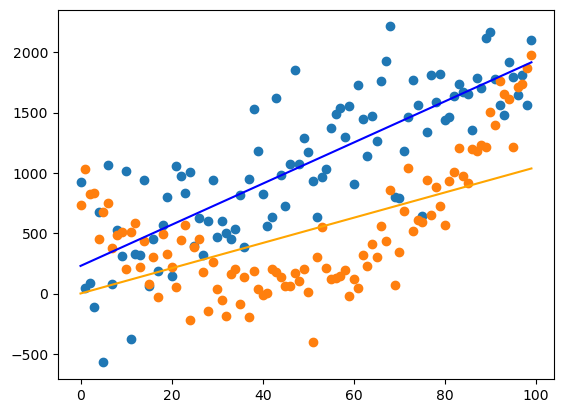
plt.plot(d['x'], d['y1'], 'o')
plt.plot(d['x'], d['y2'], 'o')
reg1 = scipy.stats.linregress(d['x'], d['y1'])
y1_pred = reg1.slope * d['x'] + reg1.intercept
plt.plot(d['x'], y1_pred, 'b')
reg2 = scipy.stats.linregress(d['x'], d['y2'])
y2_pred = reg2.slope * d['x'] + reg2.intercept
plt.plot(d['x'], y2_pred, 'orange')
reg2.rvalue
np.float64(0.3355473441544886)
Exercise 2: Fit curves from multiple animals, compare params using statistics#
The file 6.01_linear_regression_exercises_2.npz contains two datasets, y_ctrl and y_treat with the x-values in x.
y_ctrl and y_treat are 100x10 matrices with control and treatment data from 10 animals:
100 rows correspond to the y values for each of the 100 x-values
10 columns correspond to data from 10 animals.
Your task is to:
Perform linear regression on each of the 10 animals for the control and treatment data. You should get 10 slope and intercept parameters for the control and for the treatment data (20 in total).
Compare the 10 slope parameters for the control and treatment data using a plot.
Test whether there exists a statistically significant difference between the regression parameters (slope or intercept) of the control and of the treatment animals.
Exercise 2a: Perform linear regression on each animal#
# your solution here
d = np.load('6.01_linear_regression_exercises_2.npz')
d
nb_animals = d['y_ctrl'].shape[1]
slopes_ctrl = []
intercepts_ctrl = []
for animal in range(nb_animals):
res = scipy.stats.linregress(d['x'], d['y_ctrl'][:, animal])
slopes_ctrl.append(res.slope)
intercepts_ctrl.append(res.intercept)
slopes_treat = []
intercepts_treat = []
for animal in range(nb_animals):
res = scipy.stats.linregress(d['x'], d['y_treat'][:, animal])
slopes_treat.append(res.slope)
intercepts_treat.append(res.intercept)
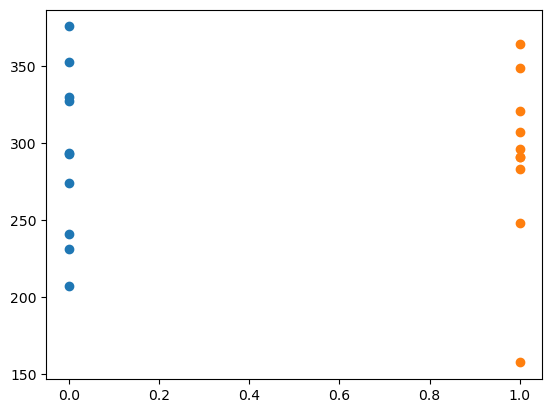
plt.plot(np.zeros(nb_animals), intercepts_ctrl, 'o')
plt.plot(np.ones(nb_animals), intercepts_treat, 'o')
[<matplotlib.lines.Line2D at 0x145930680>]
Exercise 2b: Visualize the regression parameters for the control and treatment animals#
# your solution here
Exercise 2c: Test whether the regression parameters differ between control and treatment animals#
# your solution here