Load and view data#
In the window that opens, choose Load audio from file and select the downloaded recording of fly song. Alternatively, use the menu File/New from file.
Supported formats#
Currently, the GUI can load audio data from a wide range of file types:
audio files like
wavetc. (read with soundfile, list of supported formats)hdfs files typically ending in
h5(read with h5py). Recent versions of Matlab also use this format (see the matlab docs).numpy’s
npyornpzfiles (numpy)
Note
If your favorite format is not included in this list, convert it to a supported format.
Customizing loading#
After selecting a file, a menu allows you to adjust things before loading:
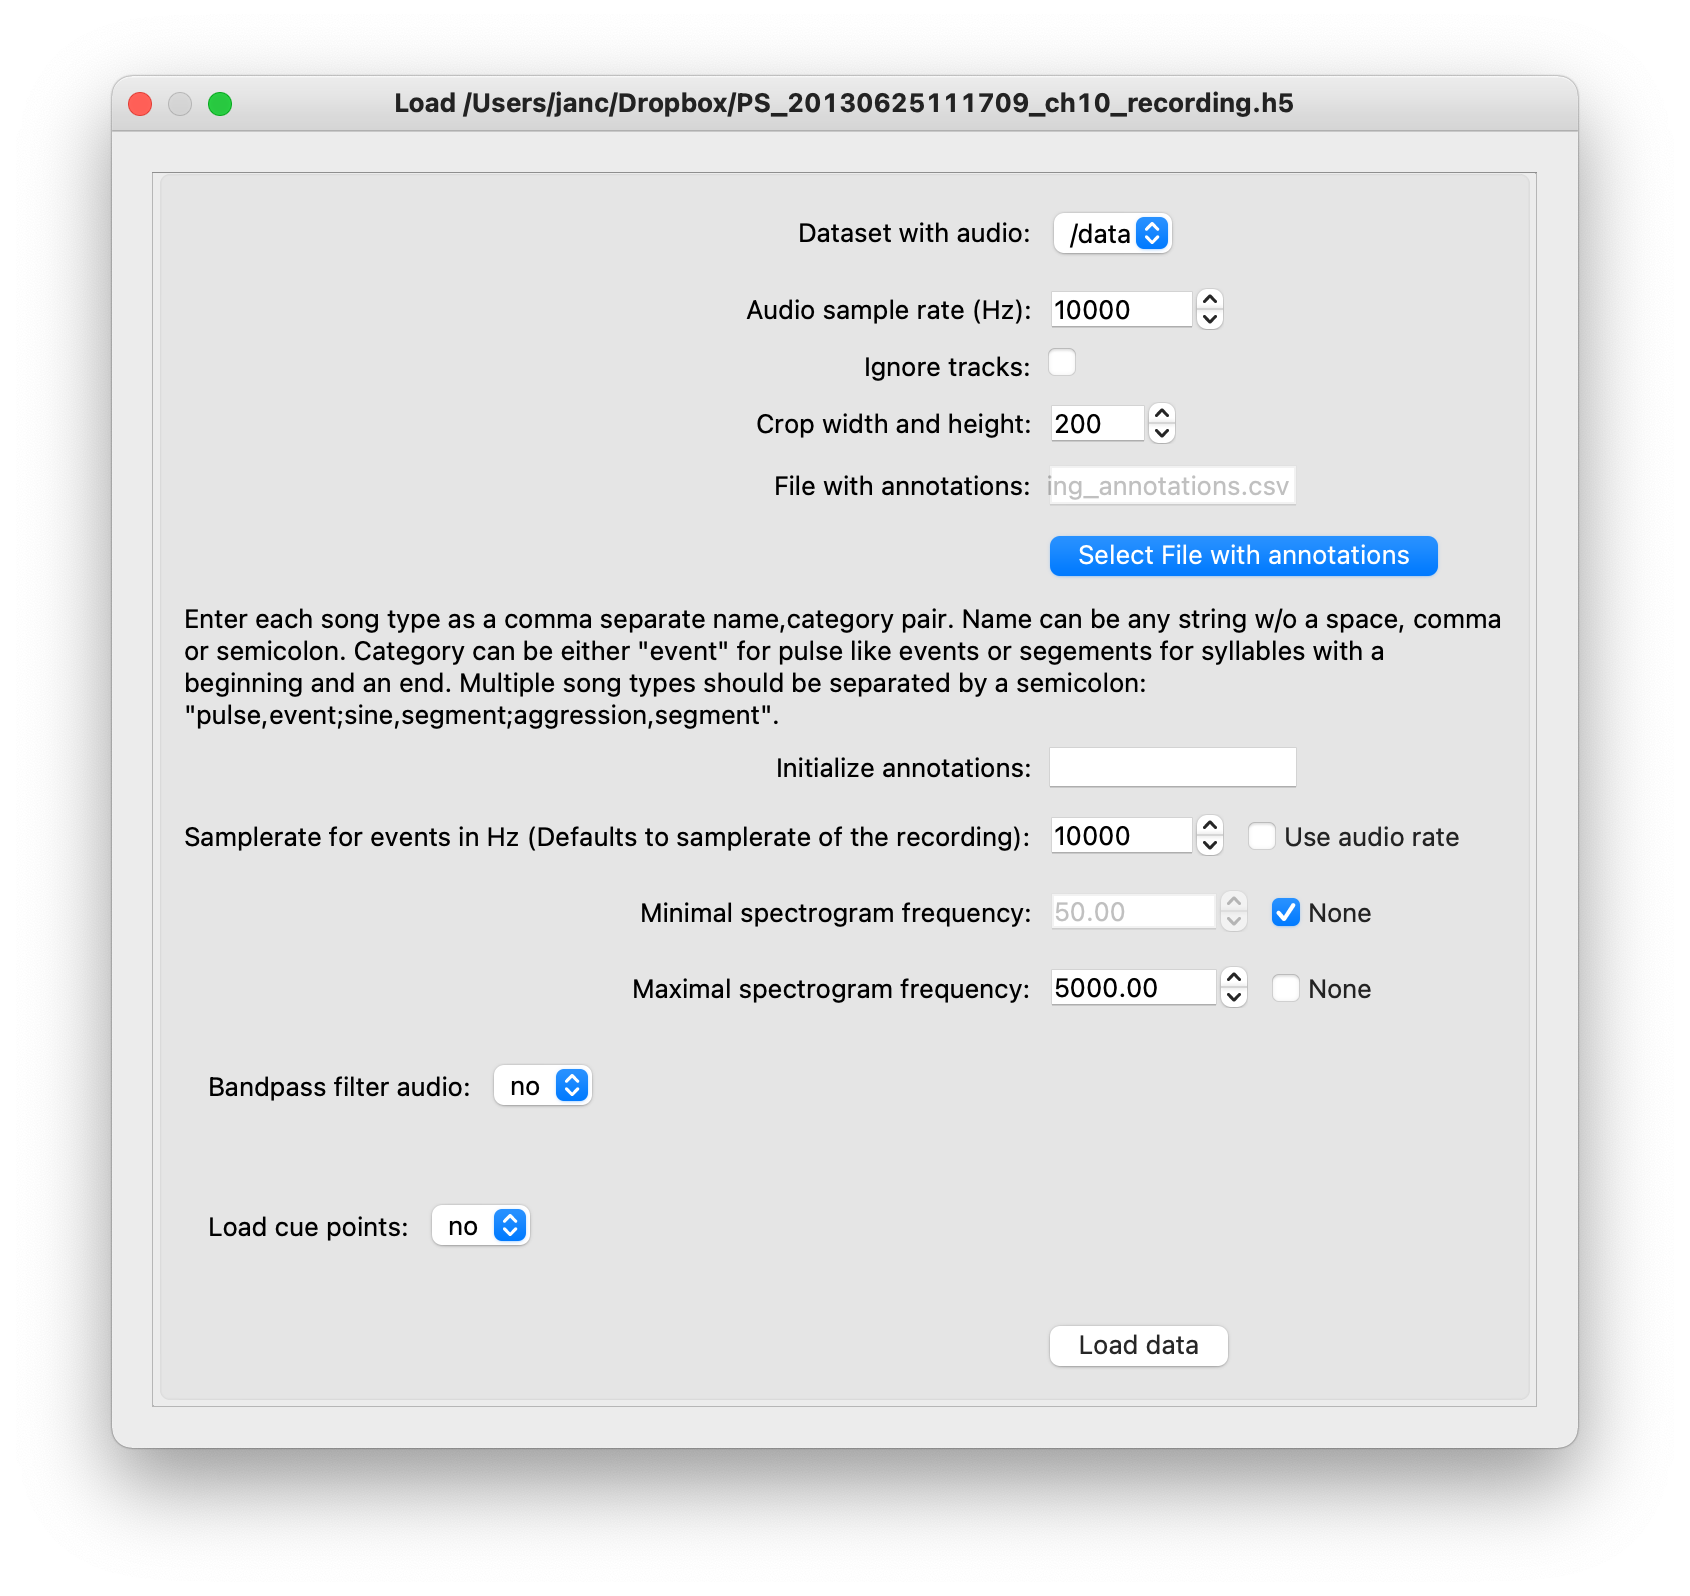
Loading screen.#
Dataset with audio: Select the variable in the
npz,matorh5file that contains the audio data. For audio (e.g. wav) andnpyfiles, this field will be empty since they do not contain multiple datasets.Data format: The format for loading the file is inferred automatically but can be overridden here.
Audio sample rate (Hz): The audio sample rate is obtained from the file for audio files, and from the
sampleratevariable ofnpzfiles (see data formats). Enter the correct sample rate for formats that lack this information.ignore_tracks (IGNORE)
crop width and height (IGNORE)
File with annotations: Load existing annotations from a
csvfile. Will default to the name of the audio file, ending in_annotations.csv. See here for a description of the expected content of that file. Select an alternative file via the Select File with annotations button. Will ignore the file if it does not exist or is malformed.Initialize annotations: Initialize the song types you want to annotate. Song types and categories are specified with a string: “name,category;name2,category2” (category is either event or segment), for instance “pulse,event;sine,segments”. After loading, you can add, delete, and rename song types via the Audio/Add or edit annotation types menu.
Minimal/Maximal spectrogram frequency: Focus the range of frequencies in the spectrogram display on the frequencies that occur in the song you want to annotate. For instance, for fly song, we typically choose 50-1000Hz. If checking
None, will default to the between 0 and half the audio sample rate.Band-pass filter audio: To remove noise at high or low frequencies, specify the lower and upper frequency of the pass-band. Filtering will take a while for long, multi-channel audio. Caution: If you train a network using filtered data, you need to apply the same filter to all recordings you want to apply the network to.
Note
Many of these parameters are also exposed via the command-line when starting the GUI. See the command line docs for details.
Overview of the display and menus#
The display shows audio data from all channels (gray) in the top panel, with the currently selected channel colored white. The spectrogram of the currently selected channel is shown in the lower panel.
To navigate the view: Move forward/backward along the time axis via the A/D keys and zoom in/out the time axis with the W/S keys (See Playback/). You can also navigate using the scroll bar below the spectrogram display or jump to specific time points using the text field to the right of the scroll bar. The temporal resolution of the spectrogram can be increased at the expense of frequency resolution with the R and T keys.
You can play back the waveform on display through headphones/speakers by pressing E.
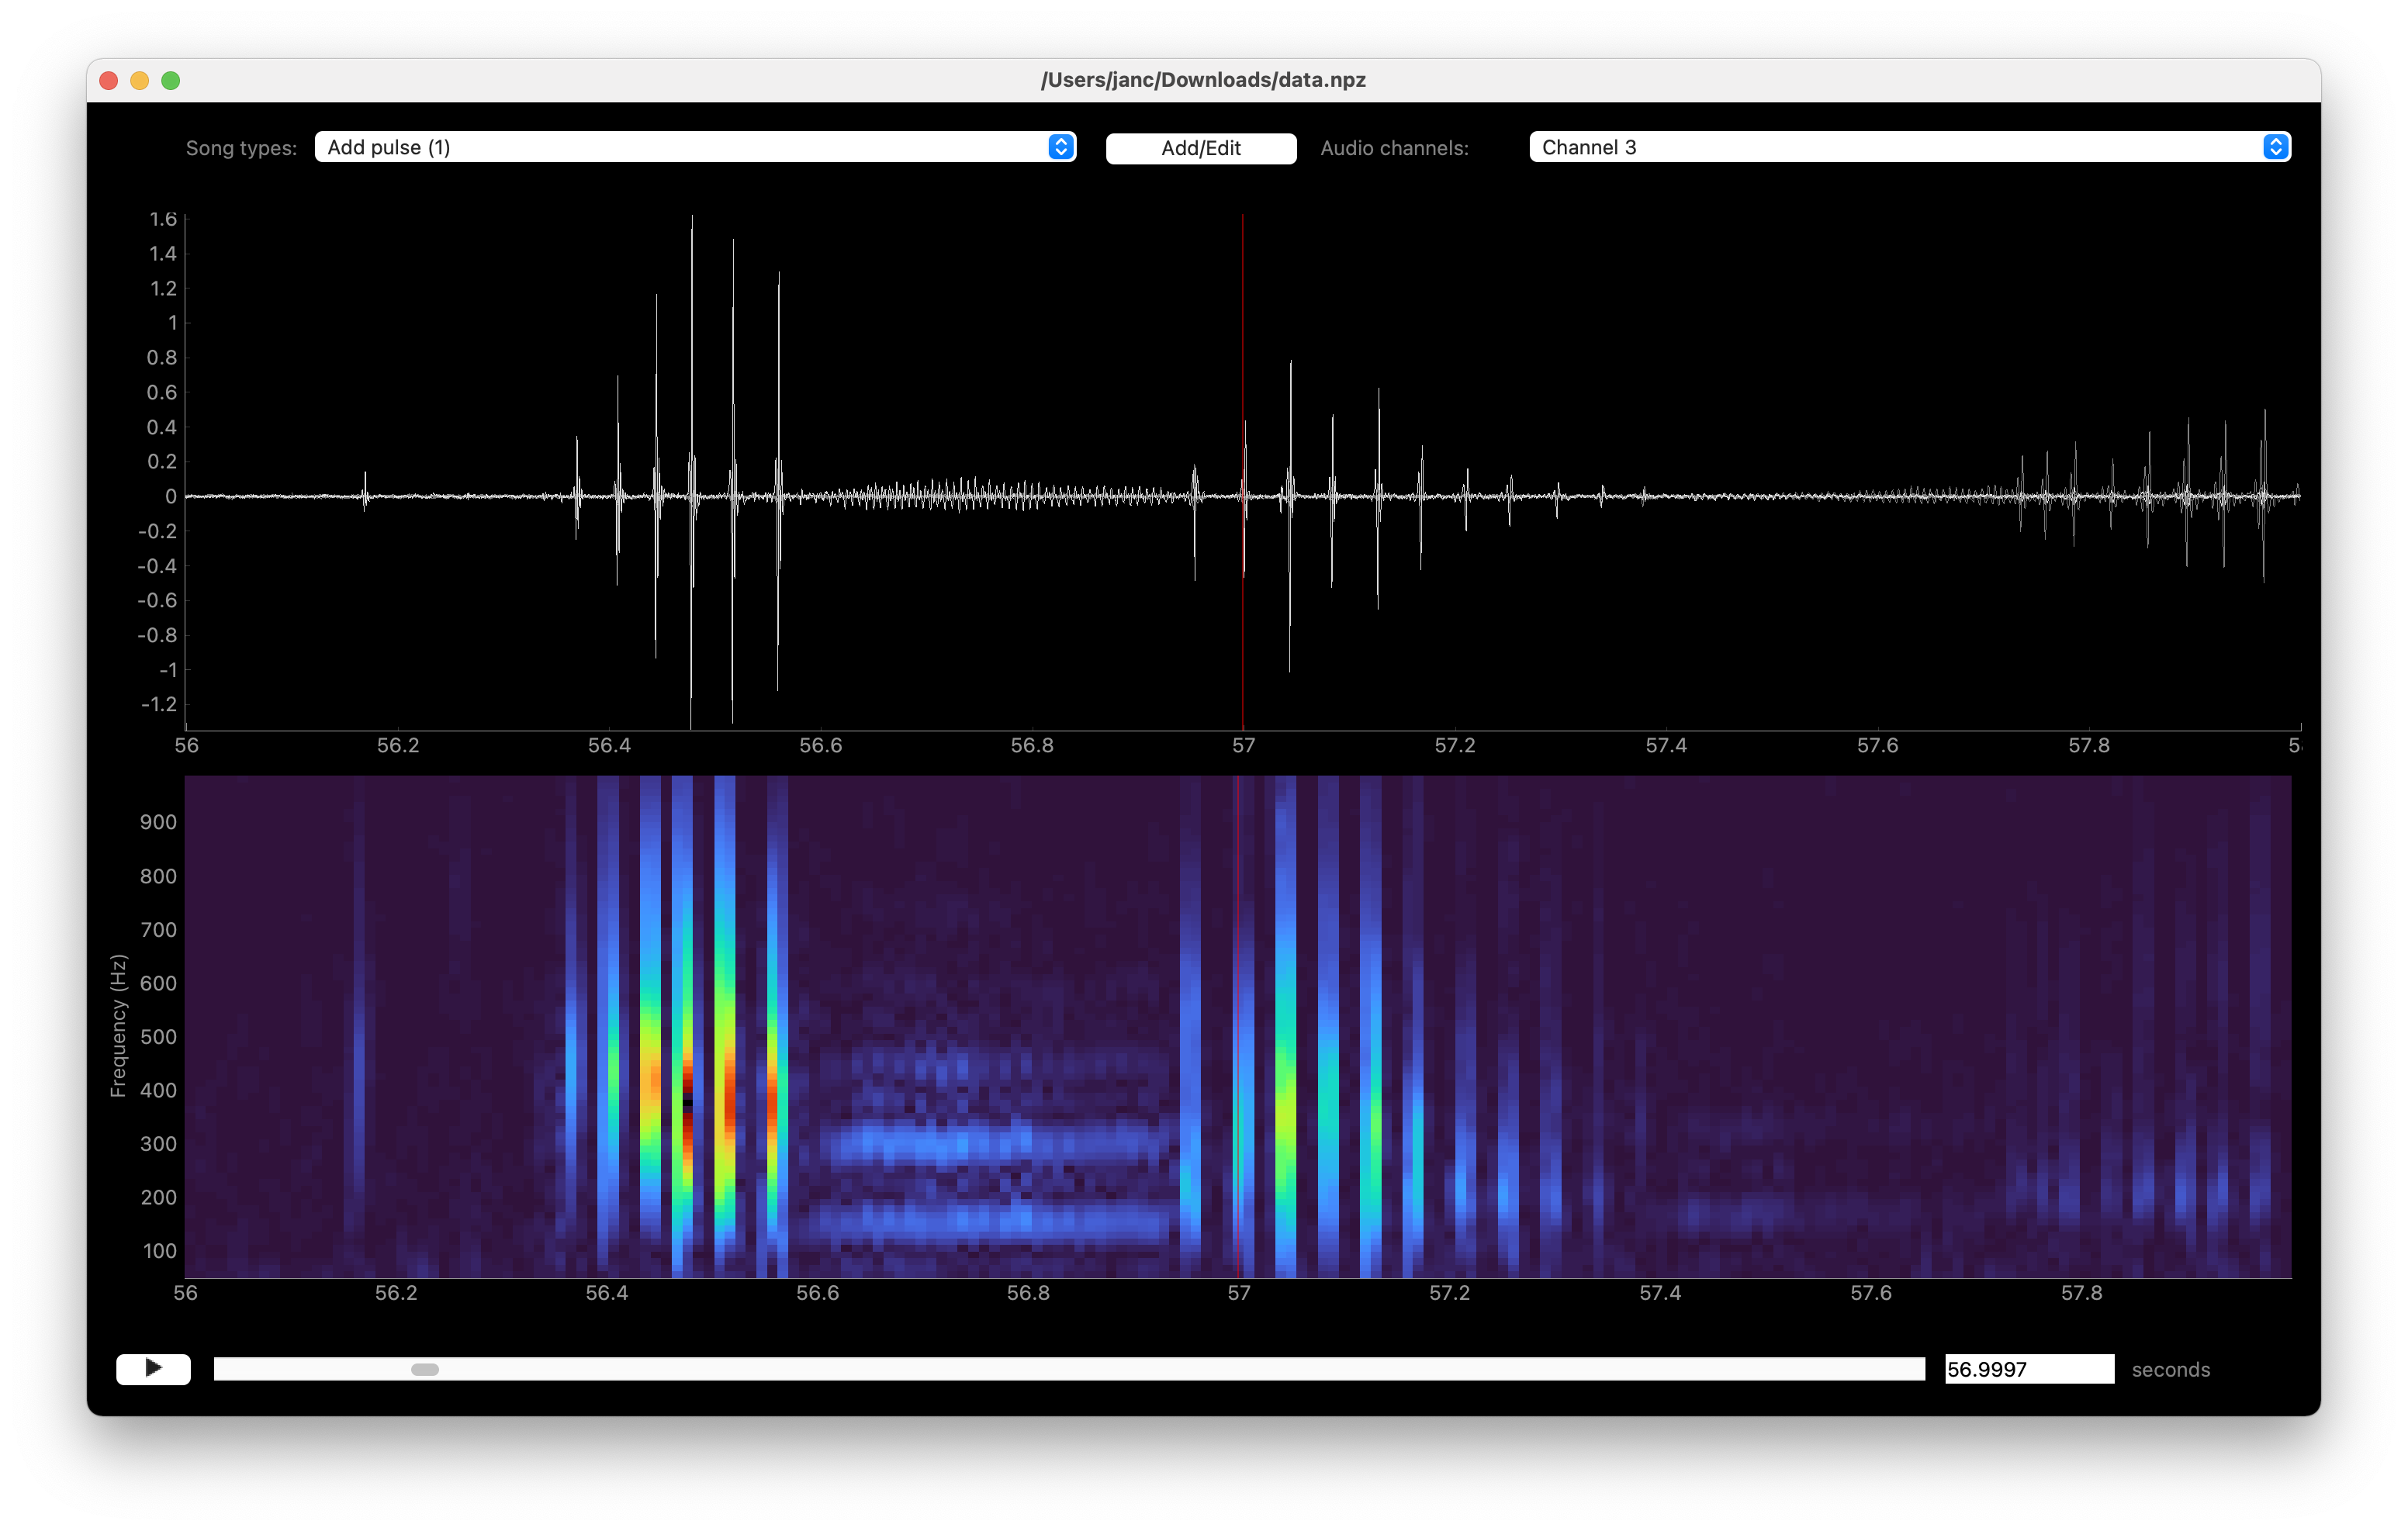
Waveform (top) and spectrogram (bottom) display of a multi-channel recording.#
For multi-channel audio, the waveform view can be further adjusted:
Hide the non-selected channels in the waveform view by toggling Audio/Show all channels.
Change the selected channel for which the spectrogram is displayed using the dropdown list on the upper right (“Channel …”). Or switch to next/previous channel with the up/down arrow keys.
Enable the automatic selection of the loudest channel in the current view with
Q(or Audio/Autoselect loudest channel).